ITarian: Endpoint Manager - Setup Kibana
Kibana is powerful elasticsearch web-based management system
Check Kibana official guide to get more information
To setup kibana follow next steps:
-
Setup DNS server or system local hosts file on your system to be pointed to itsm server address kibana.<base-domain>.
See example at dns requirements sectionIf you have no access to DNS management, you can simply update your hosts file by adding ip and host name
For windows it located at C:\\Windows\system32\drivers\etc\hosts, for linux or Mac OSX it is /etc/hosts
Example:
10.10.10.10 kibana.company.local -
Open kibana with browser by following https://kibana.company.local
-
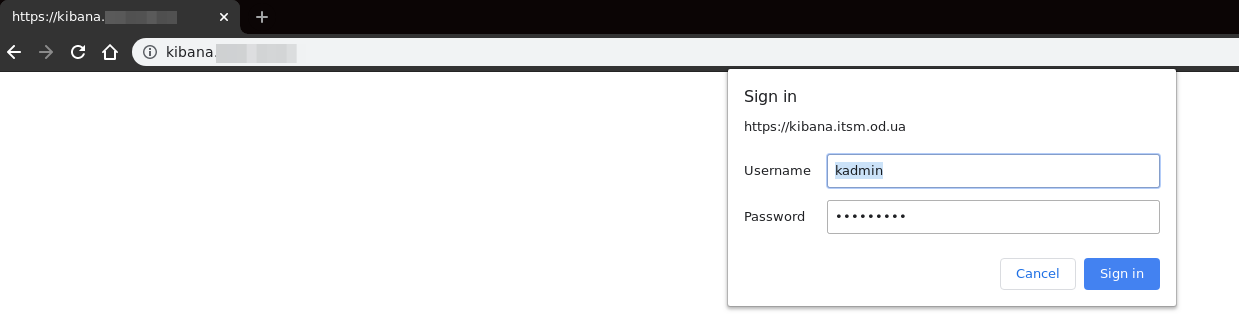
Kibana protected with basic http authorization. Login is kadmin
Password generated randomly every start. To get password you need to run at command line next command:
docker logs itsm-router-1 | grep kadmin
Output can be like next:
web_1 | Adding password for user kadmin
web_1 | Login for kibana is 'kadmin'. Password for basic authentication of kibana is 'WzBBdvemIHAOPfq5'
Copy password and fill prompt with login "kadmin" and password you get from command line
Generated password is not handy if you going to use kibana often. There are exists way to set predefined password.
You need extend .env file with next line
ITSM_KIBANA_BA_PASS=mysecretpassword
After thay you need to rebuild your on-premise installation with commands
docker-compose down

                    docker-compose up -d
Now you can access to kibana with predefined user kadmin and password mysecretpassword -
If you see greeting banner
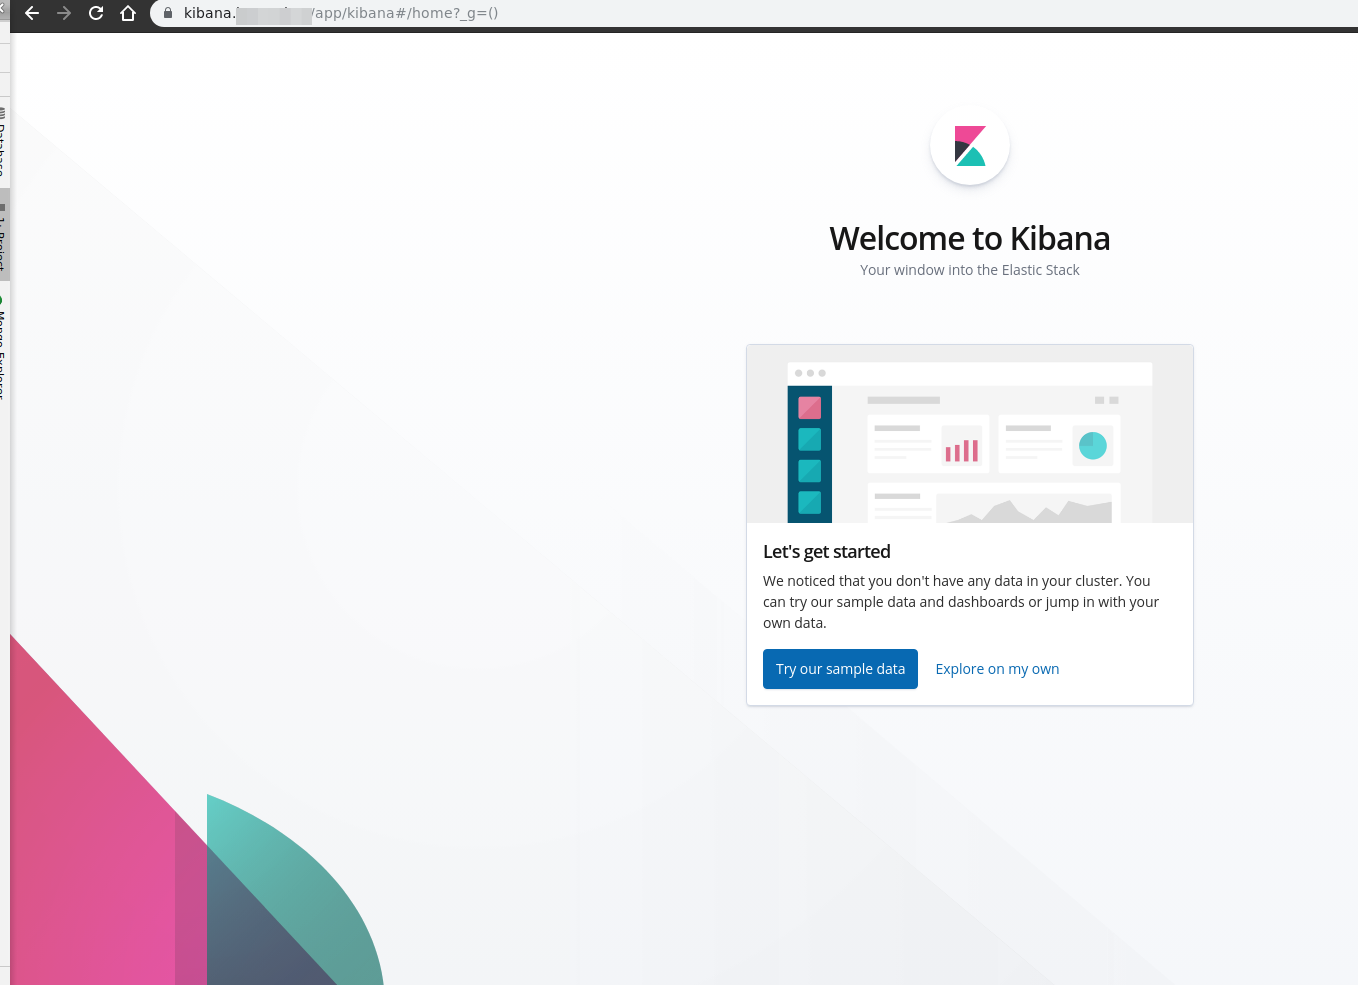 just press "Explore on my own" button
-
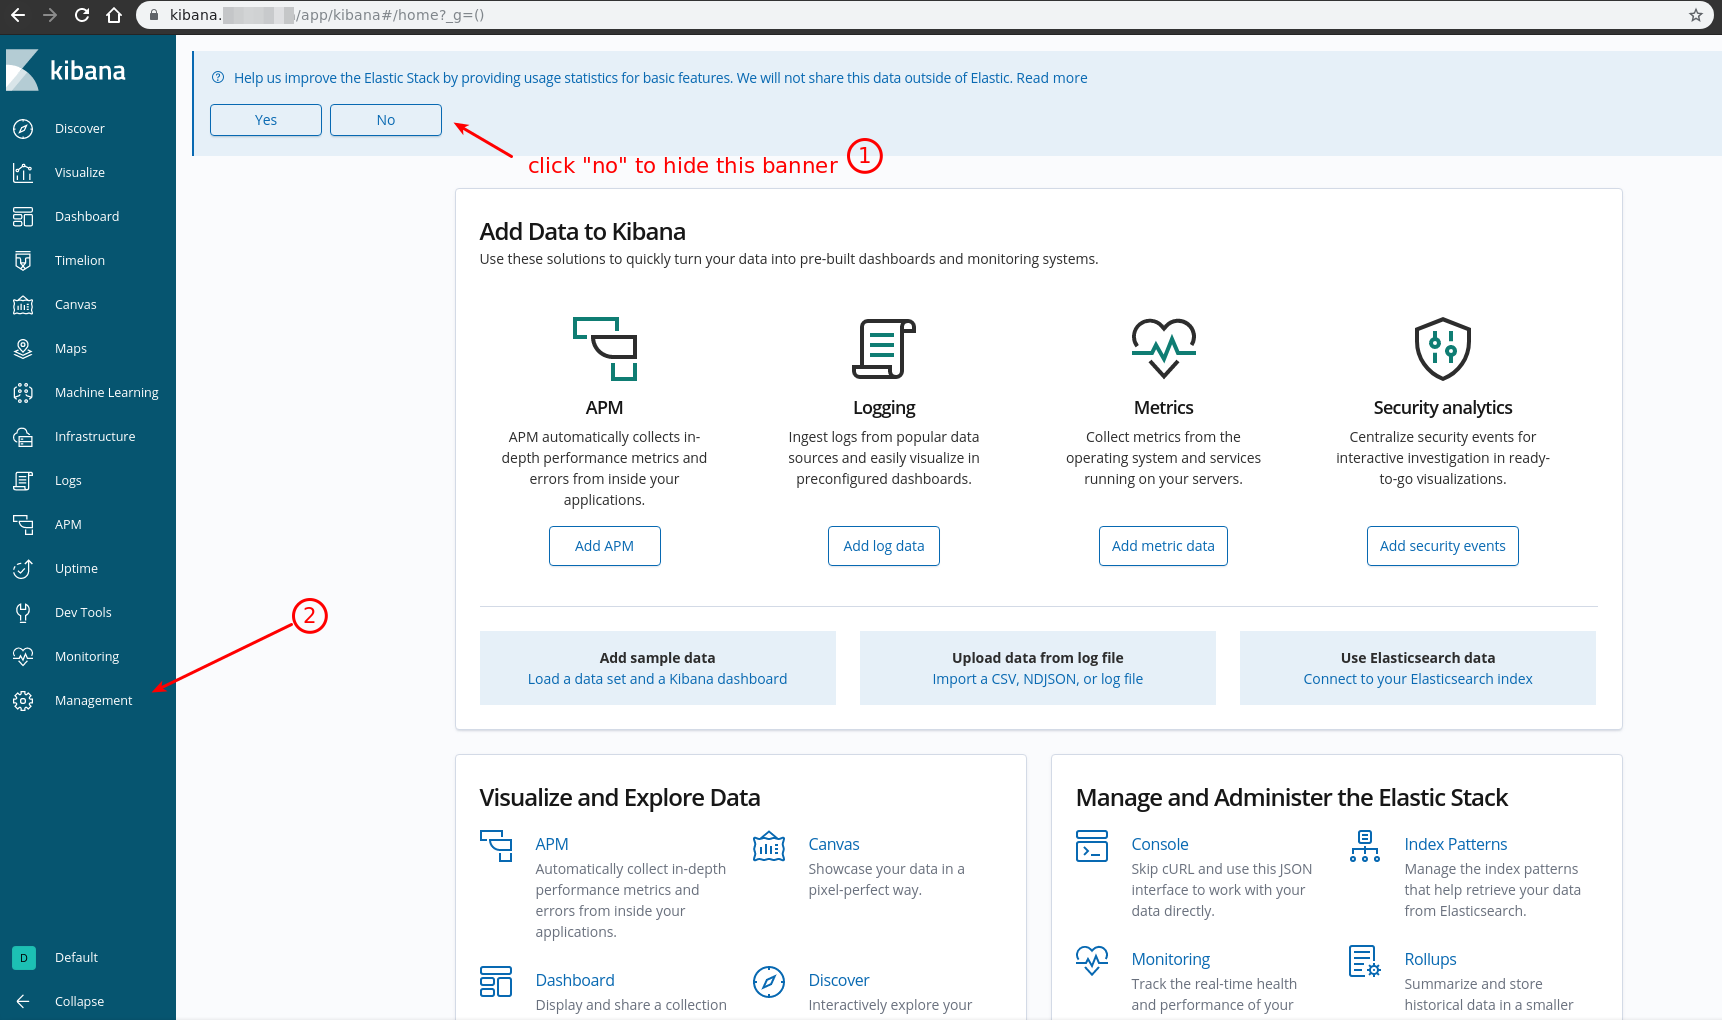
On Kibana Home page go to Management
-
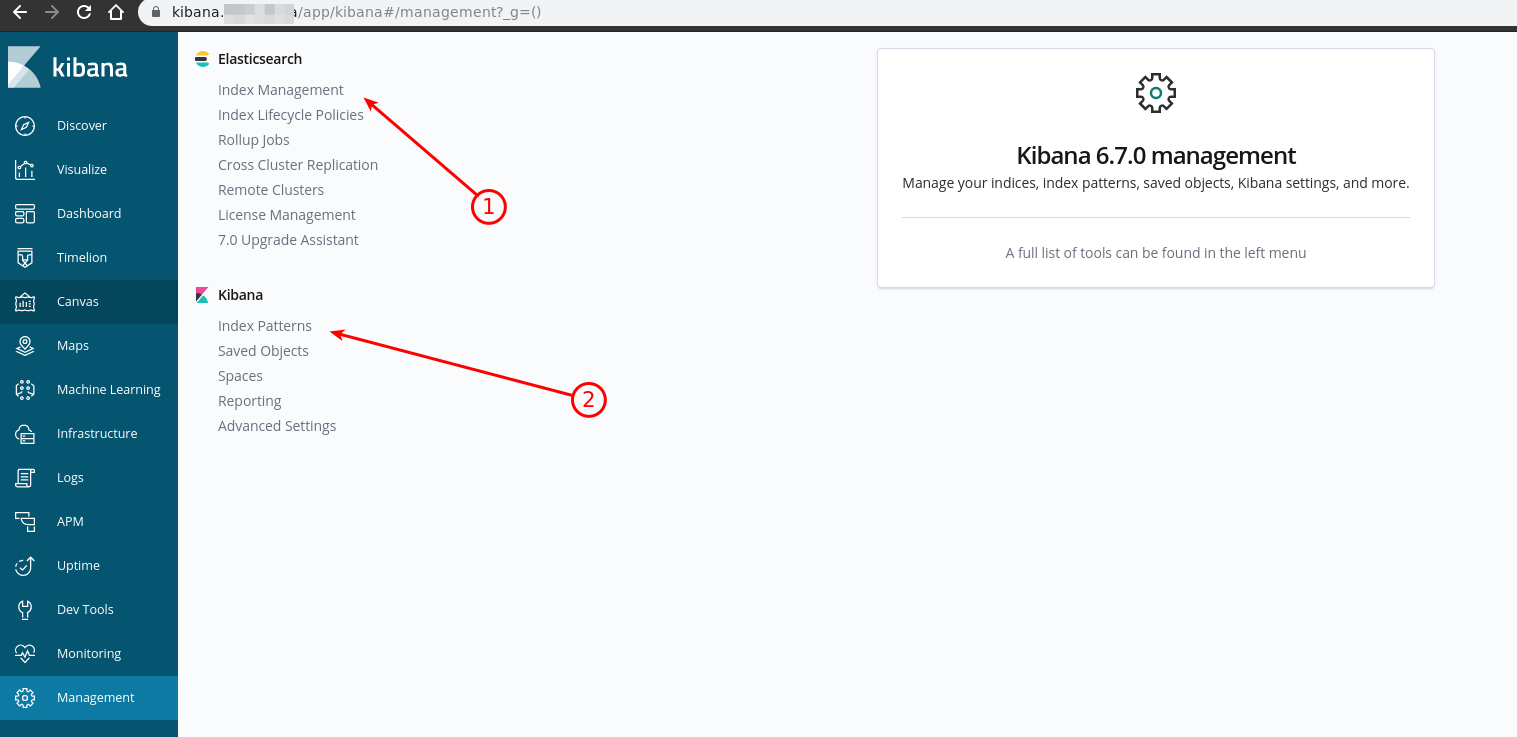
On Kibana Management page we can choose 2 options:
-
Choose "Index Management" in case you want to cleanup some indexes to get more free space on your server
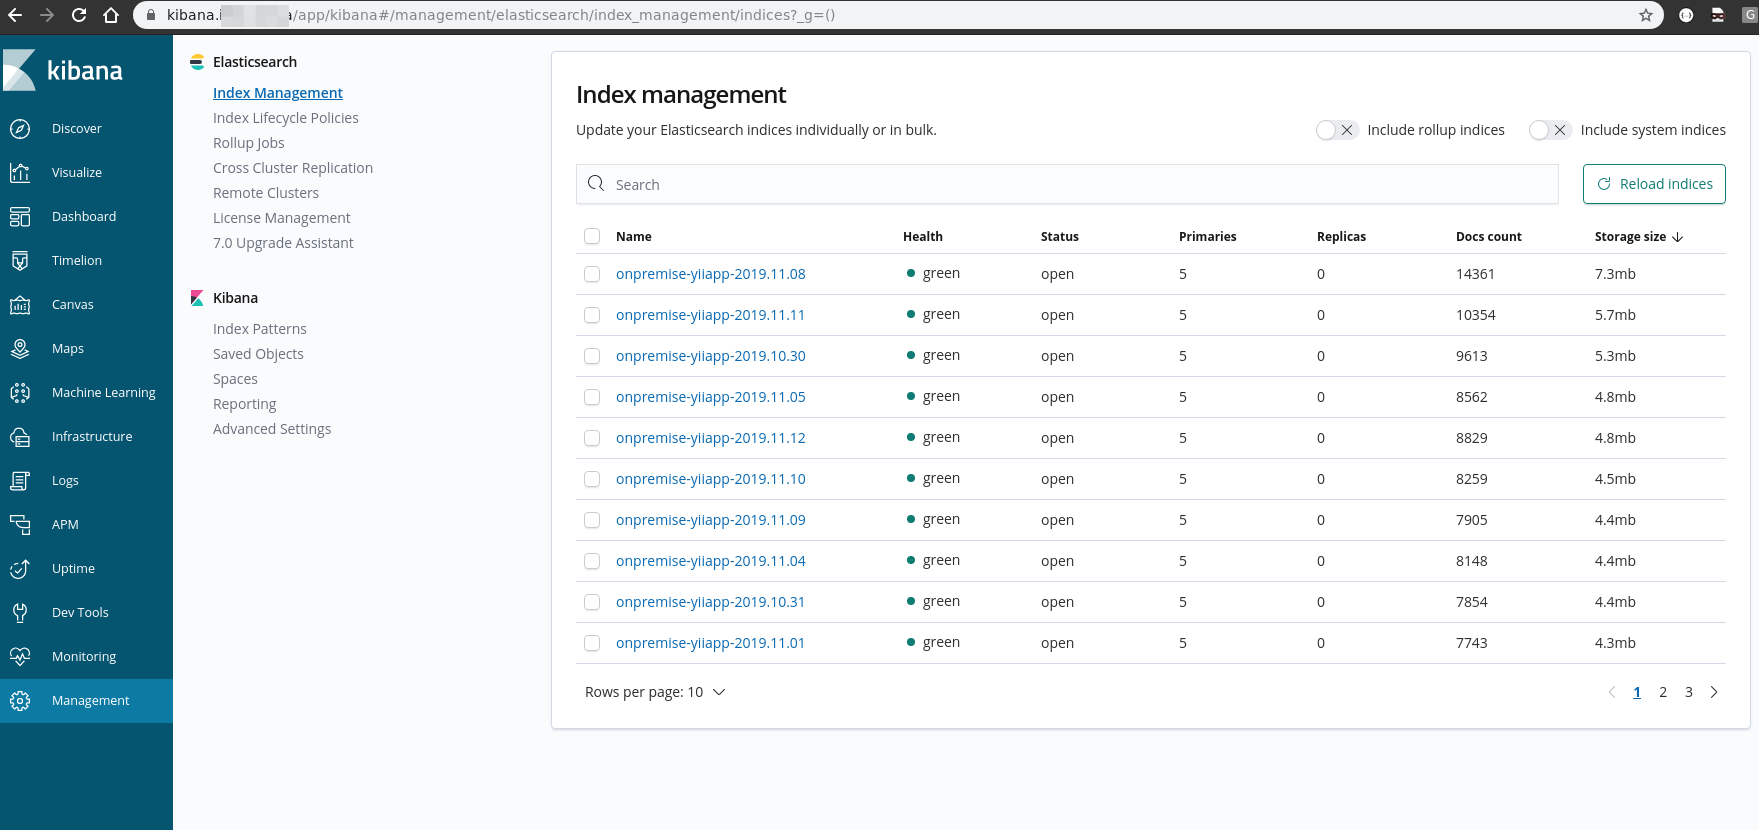
You can sort indexes by size by clicking on column Storage size in the table
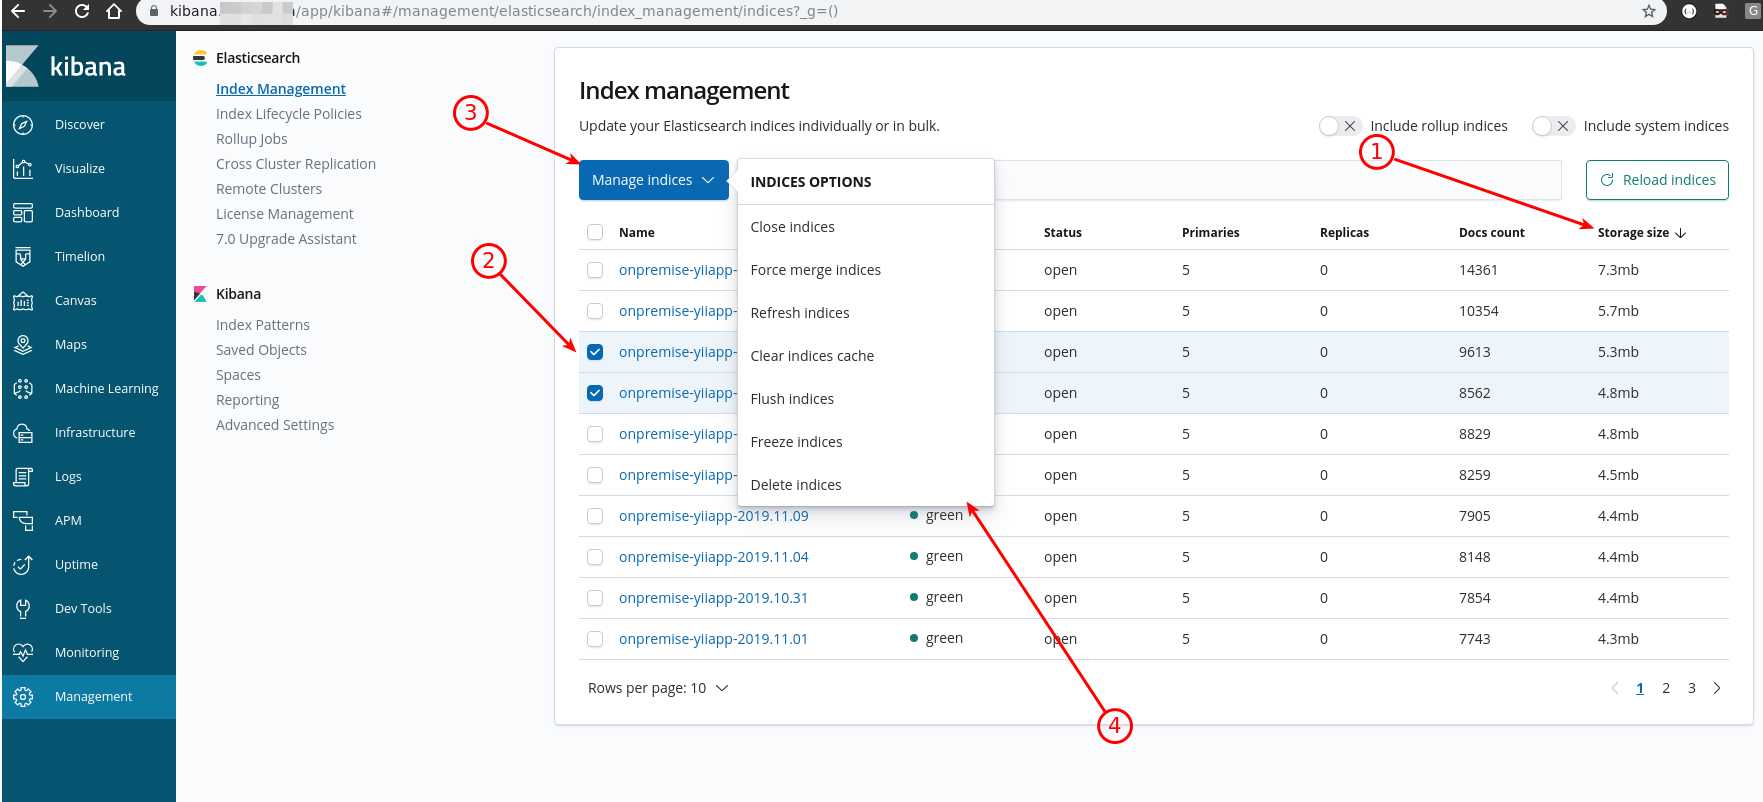
When you chose one or more indexes by selecting checkboxes the button "Manage index/indices" appeared and you can select from dropdown required action
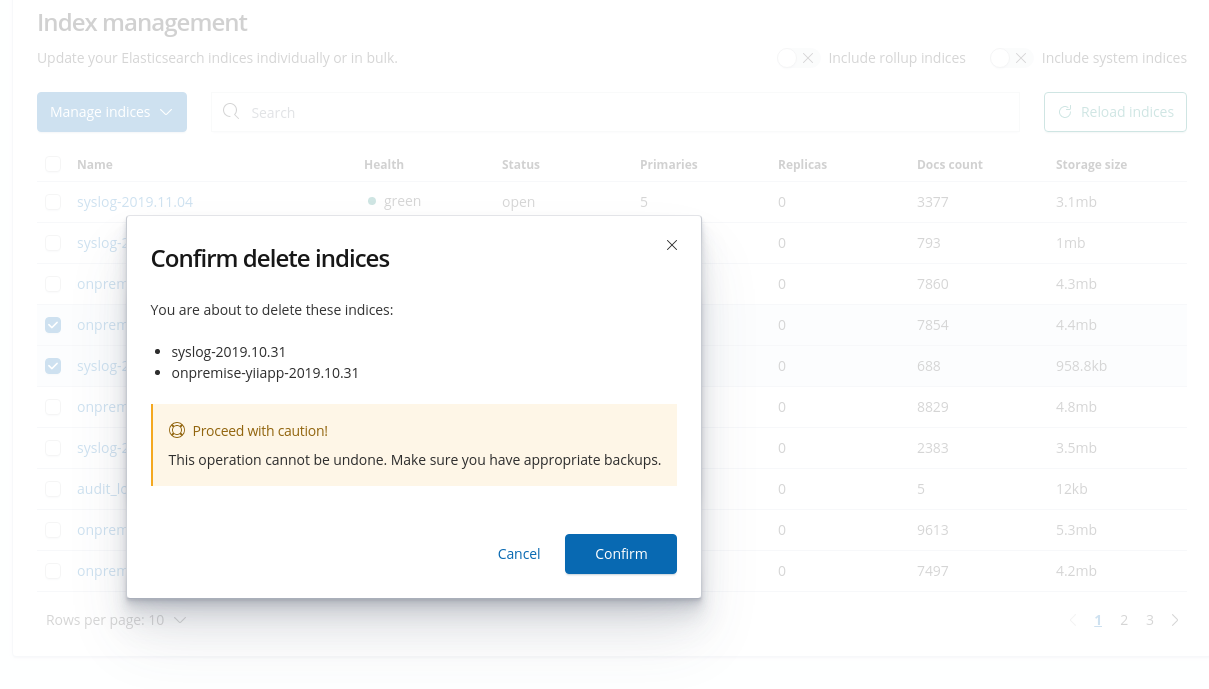
Confirm deleting and that's it
-
Choose "Index Patterns" to setup viewing logs from indexes
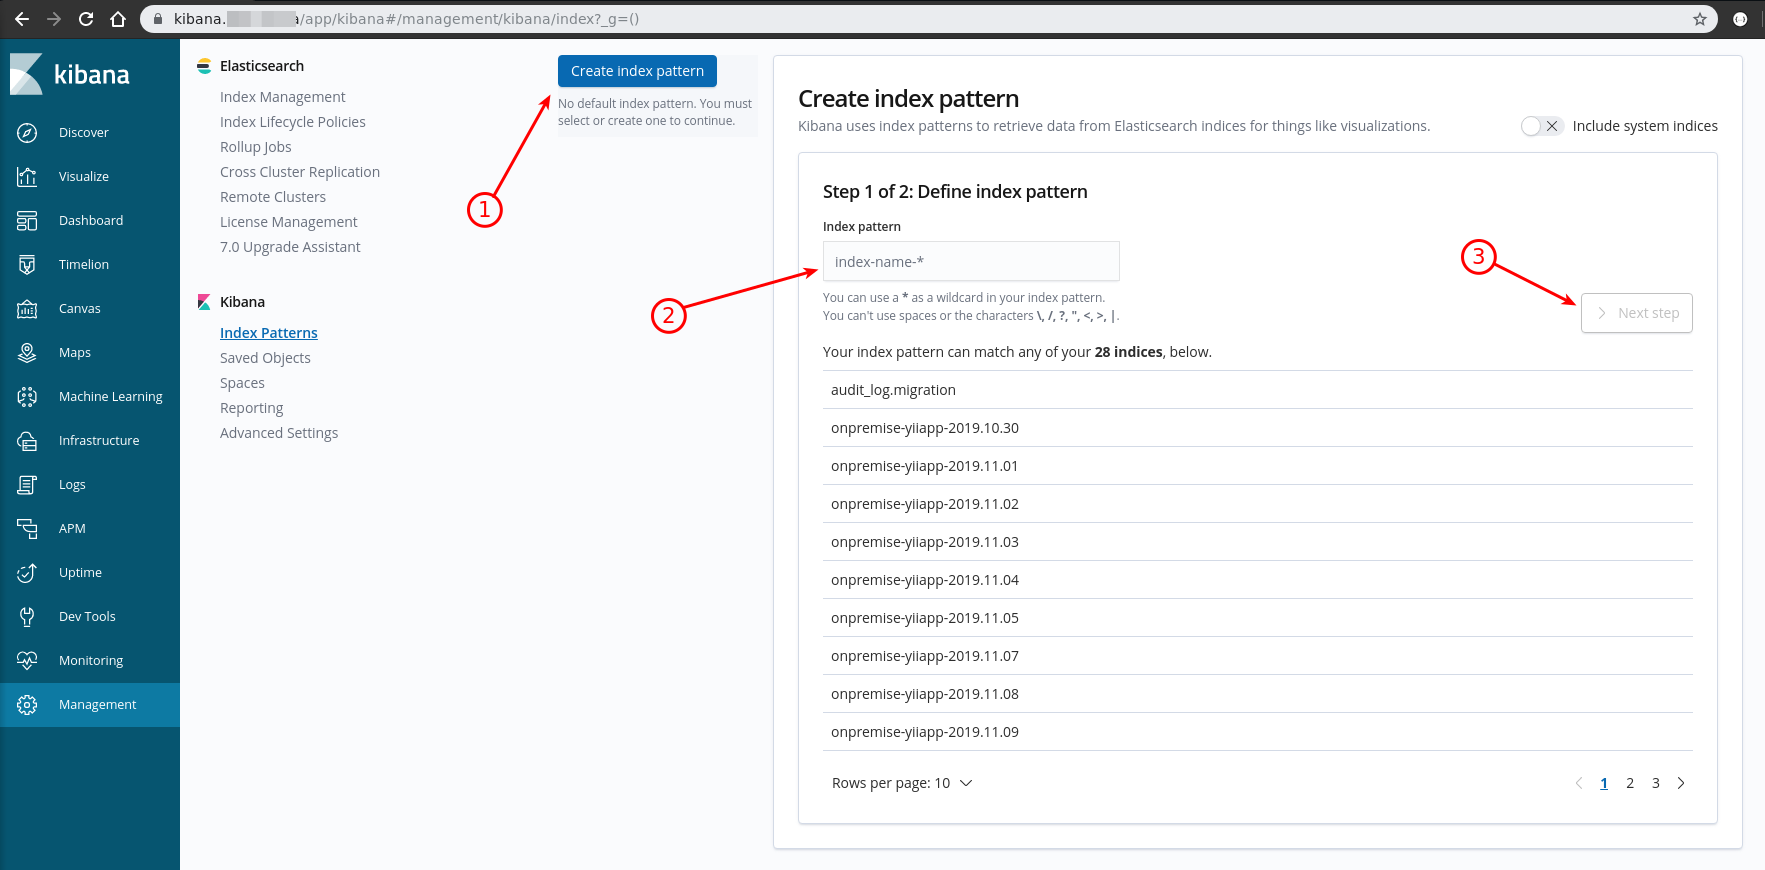
Click "Create index pattern" button
Enter in the index pattern input field "pattern prefix" You have to create next prefixes:
onpremise-yiiapp-*
syslog-*
NOTE: Repeat create index pattern operation for each prefix separatelyClick "Next step"
And select from dropdown @timestamp option
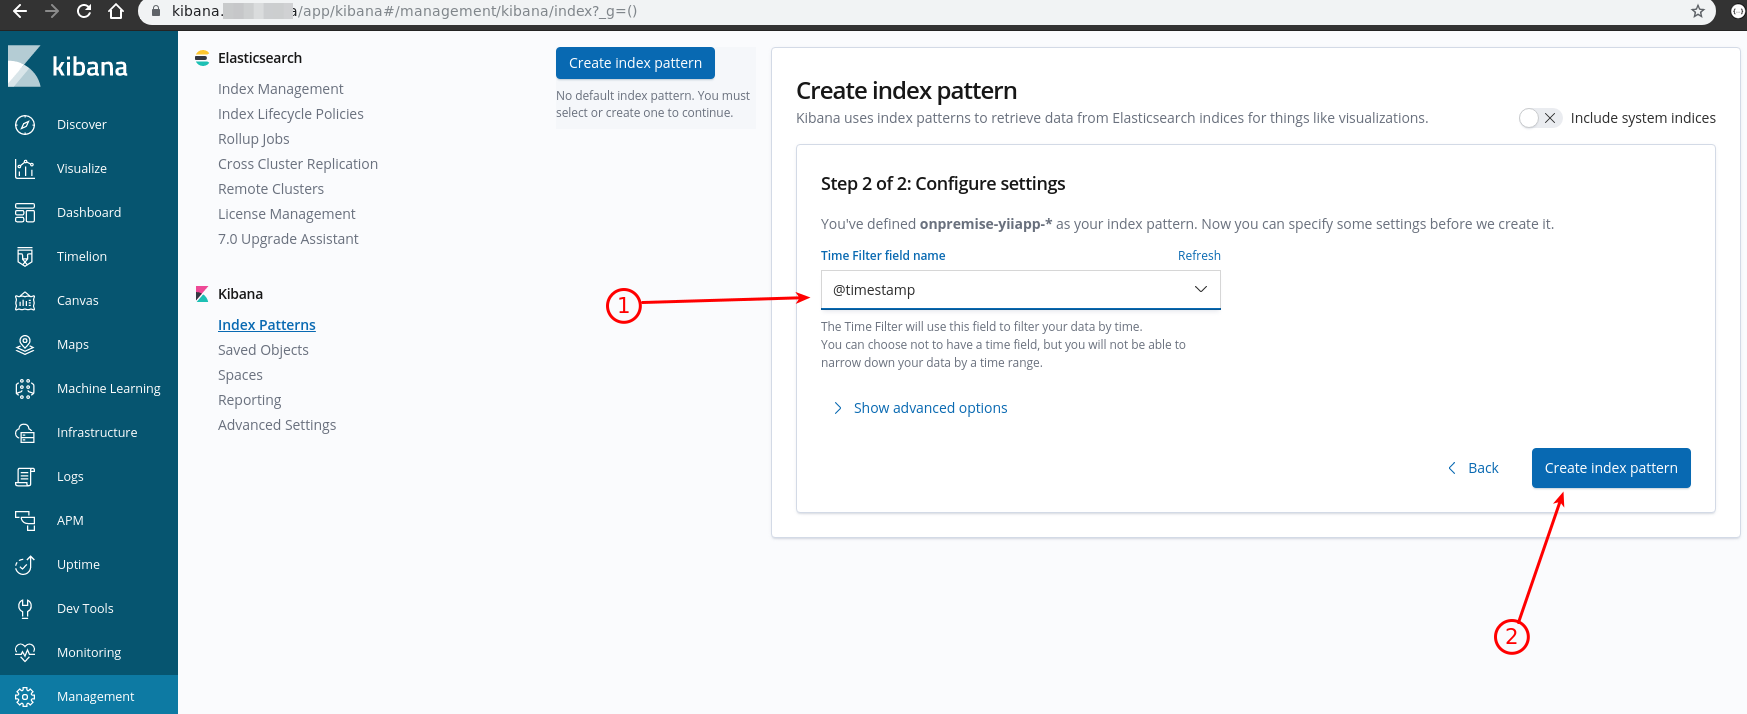
Click "Create index pattern" button at the bottom right corner
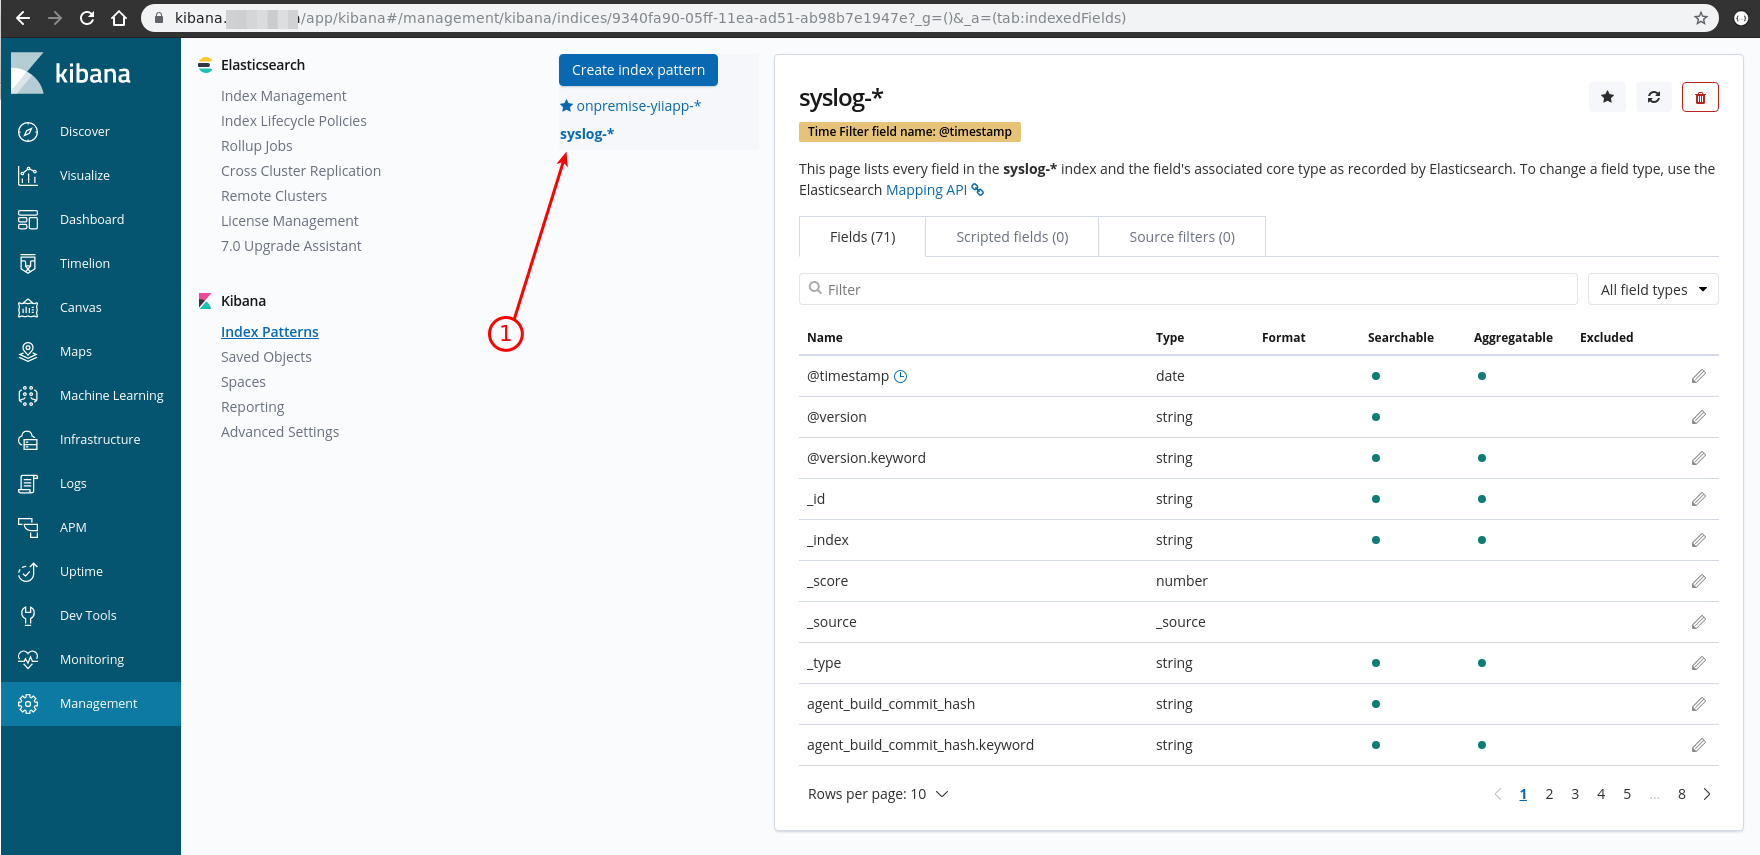
You can view info about every index patterns
To browse index logs now go to side menu "Discover" item
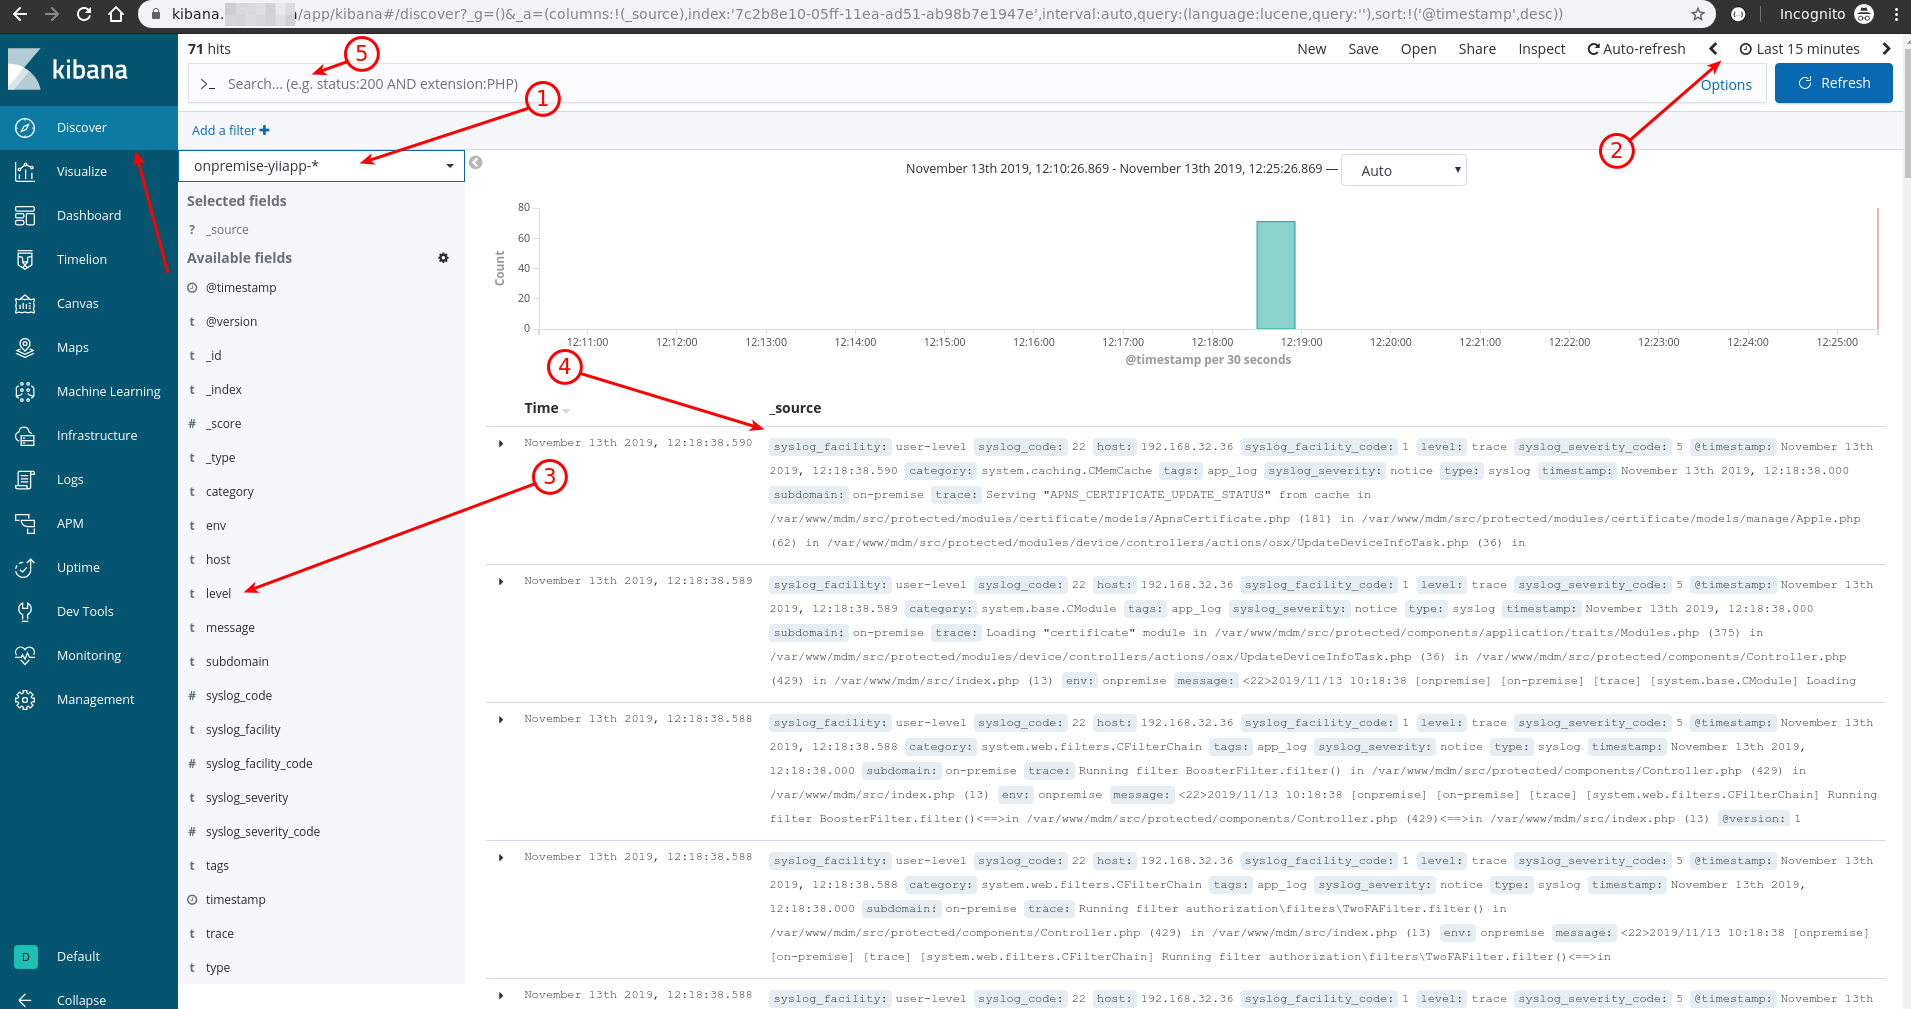
At the discover page you can:
- Select between your saved patterns
- Filter by date range
- Select columns you prefer to see in the table
- See column info for each record / sort by column
- Filter by keywords
Browsing logs can be helpful in some cases where you can't find what is going wrong
-